

Equans
How Equans Belgium follows hundreds of client buildings on Energis.Cloud: automatic data, technical installations, ISO 50001 reports and yearly consumption reports.
Dieter Rauwoens, Department Manager Smart Buildings, Equans


The energy management platform to lead the energy transition
From the meter to the saving
Trusted by energy professionals

3,000+ sites
Energis.Cloud serves as Action's single, unified platform for monitoring the energy consumption of its more than 3,000 sites throughout Europe.
350+ team members
Energis.Cloud is an intuitive and easy-to-use energy platform used by over 350 of our team members. It made our data actionable, helped reduce our energy bills, and supports our ISO 50001 certification efforts.
ISO 50001
Energis.Cloud allows us to easily monitor the performance of our technical installations and automatically generates detailed reports for ISO 50001 certification.
Thousands of sites
Energis.Cloud gives us the scalability to support thousands of sites internationally. We now have more time to go deeper with insights and help our customers reduce energy costs and their carbon footprint.
Same day
During the first lockdown, a valve stayed blocked and we were losing around 70 m³ of water a day. Before Energis.Cloud we might have found it two or three weeks later; we found it the same day.
Every day
The platform runs the repetitive work automatically, on every site, every day. Your team makes the decisions.
Data is fetched on a schedule from 121 data-source connectors, and an anomaly is raised when a feed stops.
Sites, equipment and technical sheets are organised like your portfolio, with templates for each new site.
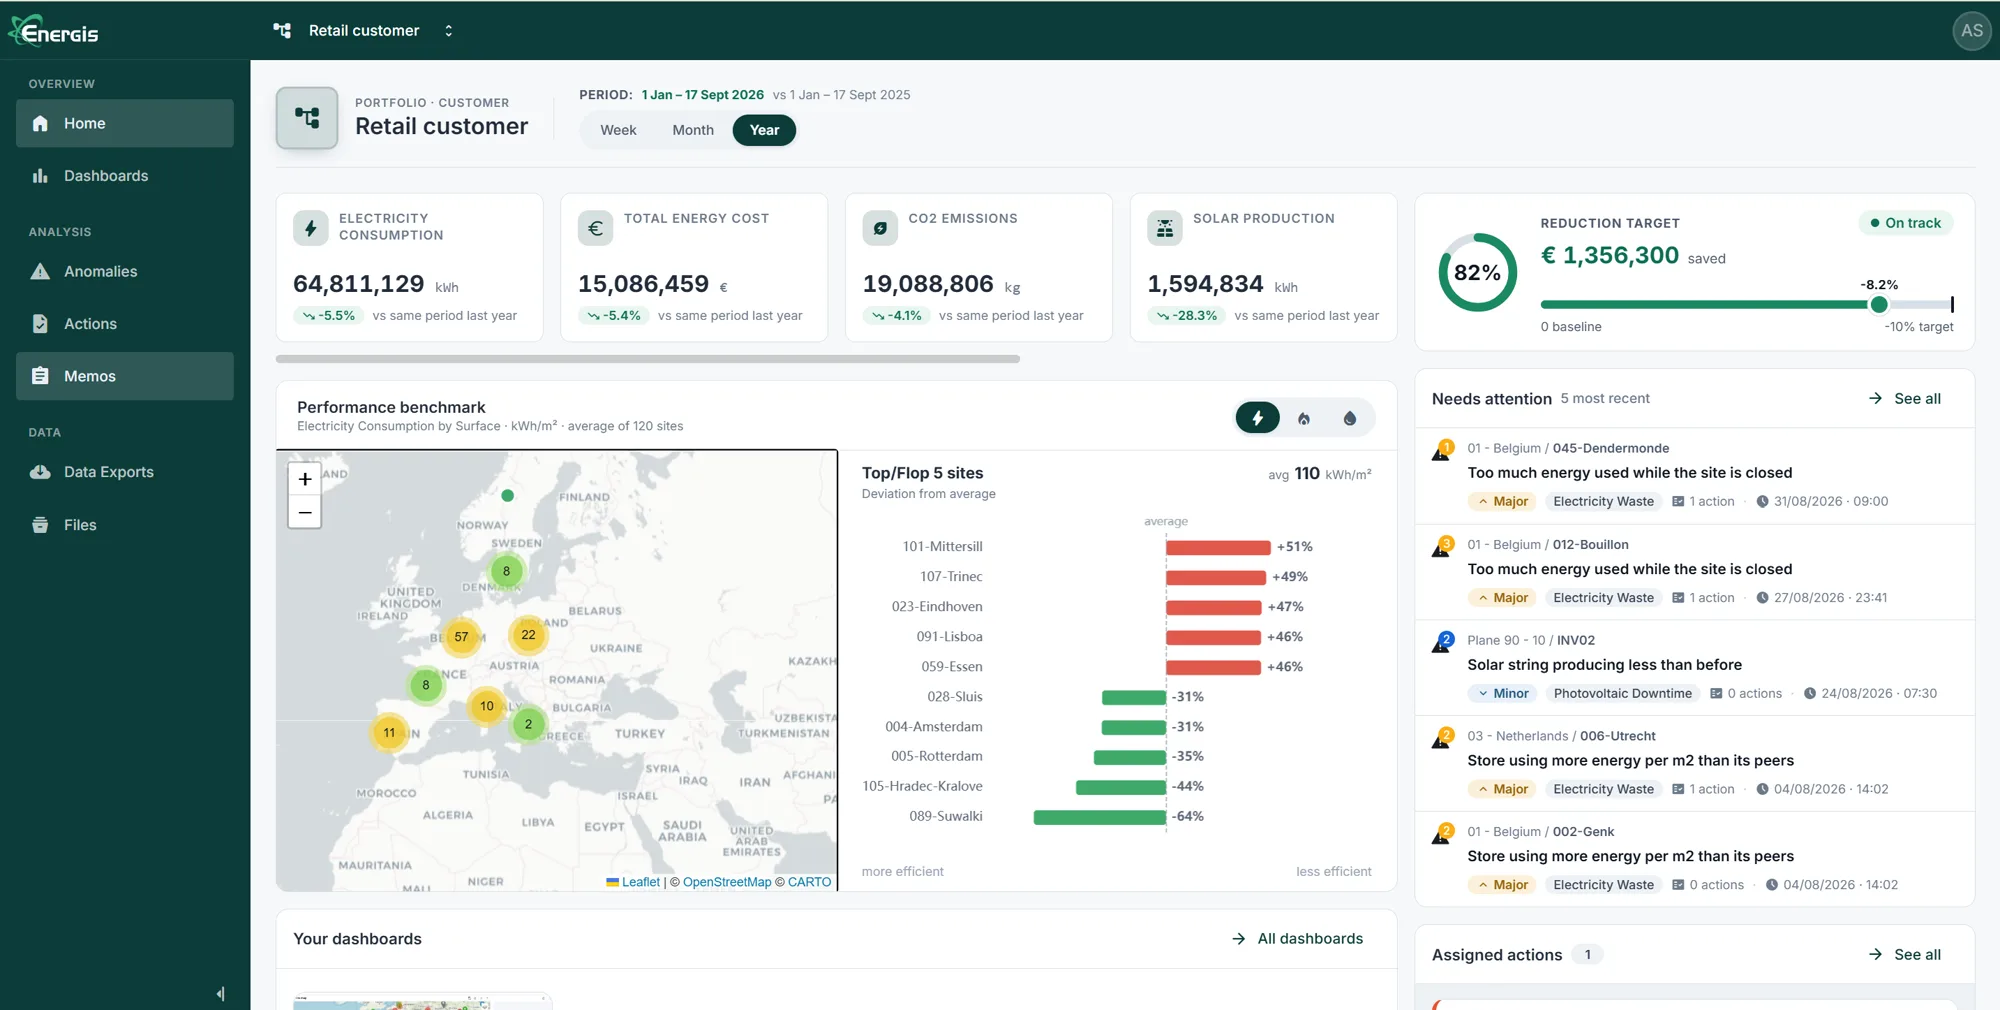
KPIs, formulas and benchmarks are calculated for every building as the data arrives.
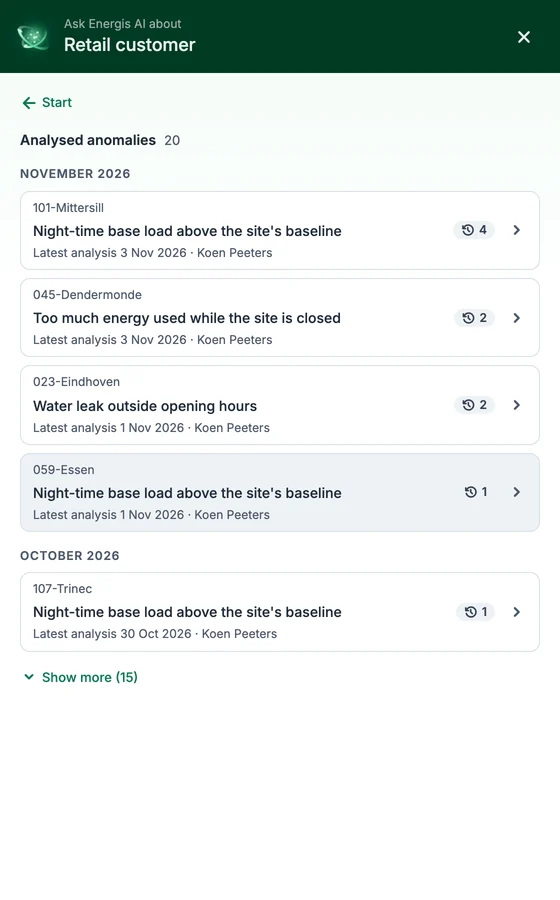
Anomaly rules check every site daily; each finding becomes an action with an owner.
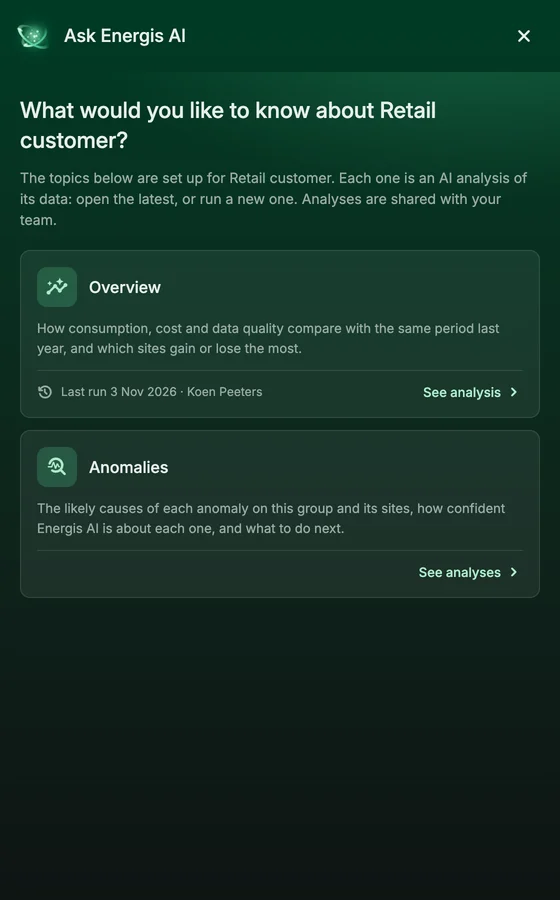
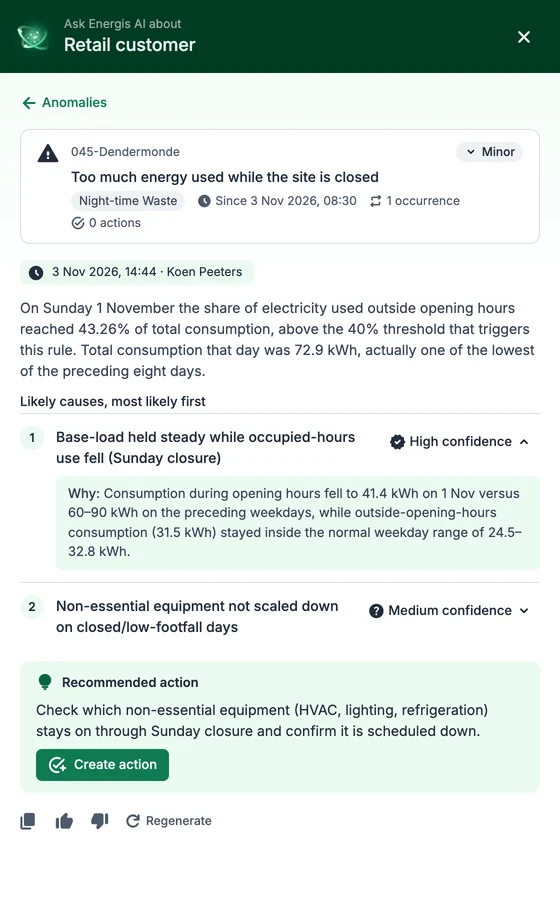
Orbit lists the likely causes, explains why and recommends the next step.
Reports go out on the dates you set; dashboards and the Energy Engagement Portal share the results.
Automated by Energis.Cloud
What the platform does automatically for its users. A data point is one series of readings, for example the electricity use of one meter. Data points are read every week; anomalies and reports count the last complete month.
Customers on video
How Equans Belgium follows hundreds of client buildings on Energis.Cloud: automatic data, technical installations, ISO 50001 reports and yearly consumption reports.
Dieter Rauwoens, Department Manager Smart Buildings, Equans
How Sedico, a cost management firm, runs invoice checks, anomaly detection and action follow-up for its clients' sites across Europe on Energis.Cloud.
David Spetter, Managing Director, Sedico
Sensorea runs Energis.Cloud at The Hotel Brussels to monitor water, energy and temperature, catch leaks and faults the same day and save about 5% more each year.
Chloé Ponsart, General Manager and Owner, Sensorea
Trusted and European
Developed by Energis in Belgium.
All data stays on servers in the European Union, in ISO 27001-compliant data centres.
You are the only owner of your data, and data exports deliver any of it as a file whenever you need it.
FAQ
Short answers about Energis.Cloud, each with a link to the page that tells the whole story.
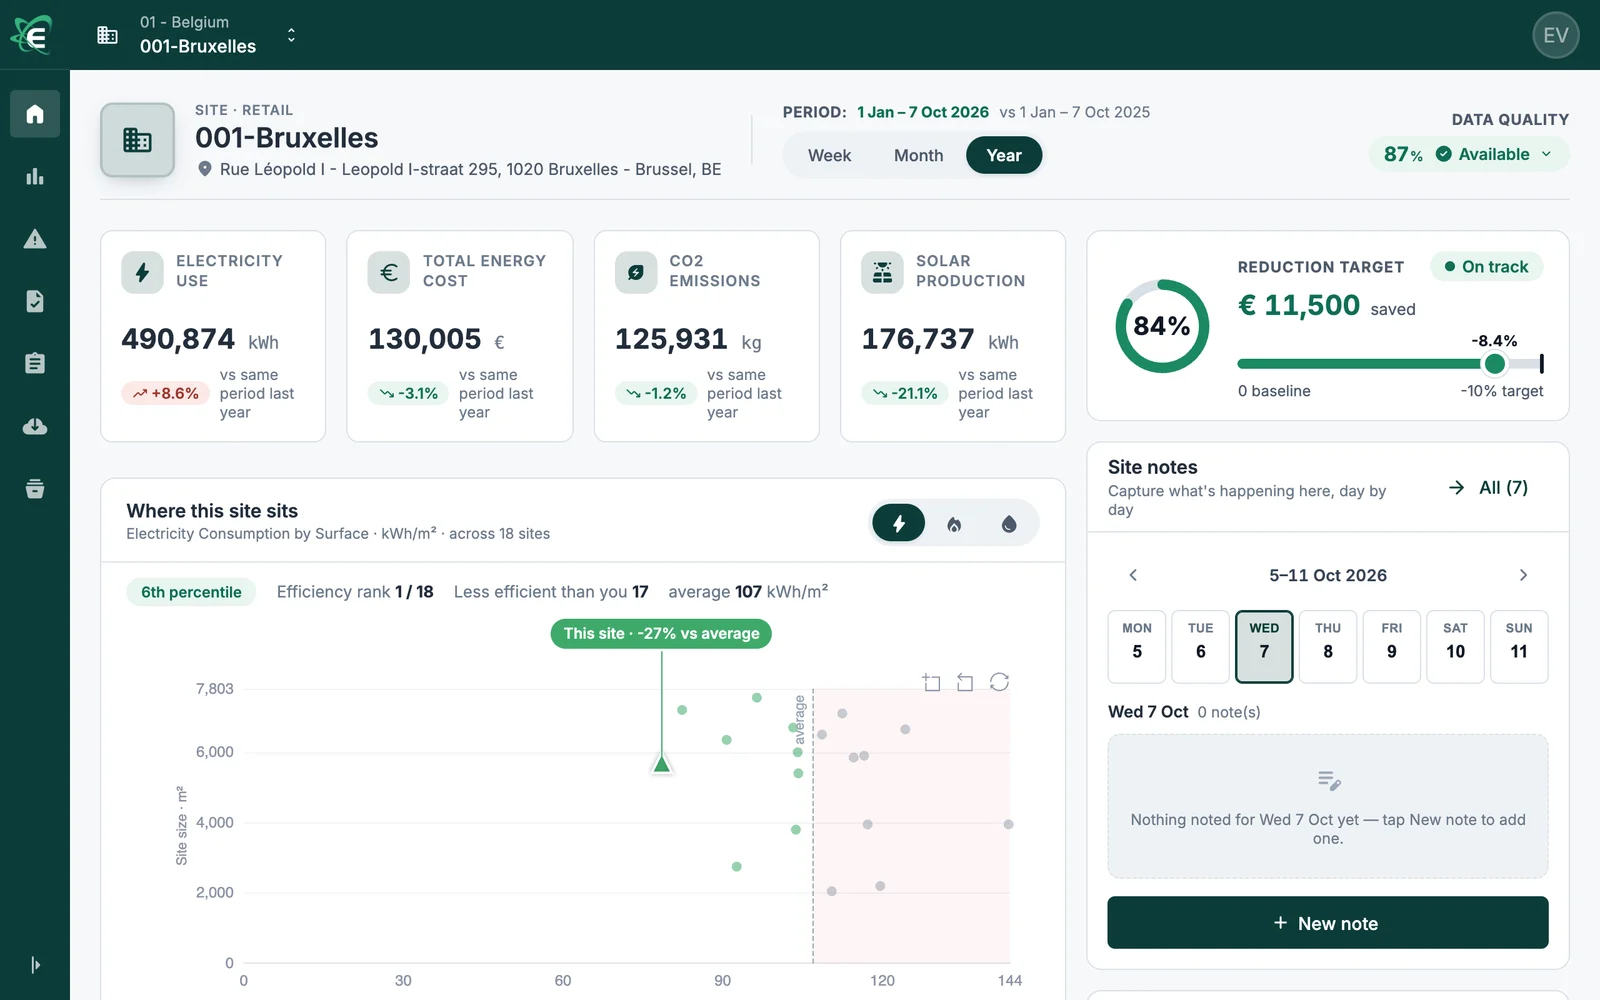
Energis.Cloud is an energy management platform for energy professionals. It collects the energy data of every site, finds waste with anomaly rules, lists the likely causes with Orbit, turns each finding into an action with an owner, and sends the reports. Energy professionals use it to serve their clients, multi-site organisations to manage their own portfolio. See the platform.
Energis.Cloud covers the whole job: data collection, anomaly detection, actions with owners and savings, reports and remote control on one platform. It comes with 121 data-source connectors, your team can adapt it itself with SelfCare, and it runs portfolios from a few sites to thousands. See the platform.
Orbit is the AI analysis in Energis.Cloud. For an anomaly, it lists the likely causes, most likely first, each with a confidence level and the reason why, and recommends the next step, which your team turns into an action. It reads the meter data with the site's anomalies, actions and memos. For a site or a portfolio, it compares the period with last year and shows where you gain and lose. See Orbit.
Usually not: Energis.Cloud starts from the data your meters, systems and suppliers already produce. For sites without data infrastructure, the Energis Field Device collects consumption, production and comfort data over LoRaWAN; it runs on more than 1,000 Action sites across Europe. See data integration.
Get started
A product specialist walks you through the platform, from the first data source to the savings report.
Cookies on energis.cloud
We use cookies to understand how our website is used and to improve it. Necessary cookies are always on; the others only with your consent. You can change your choice at any time. Cookie policy


